Quick Analysis Feature in Excel
Excel offers many tools for you to organize your data. The Quick Analysis tool to will quickly analyze and visualize data for you.
Below is a step-by-step instruction on how to use it:
Below is a step-by-step instruction on how to use it:
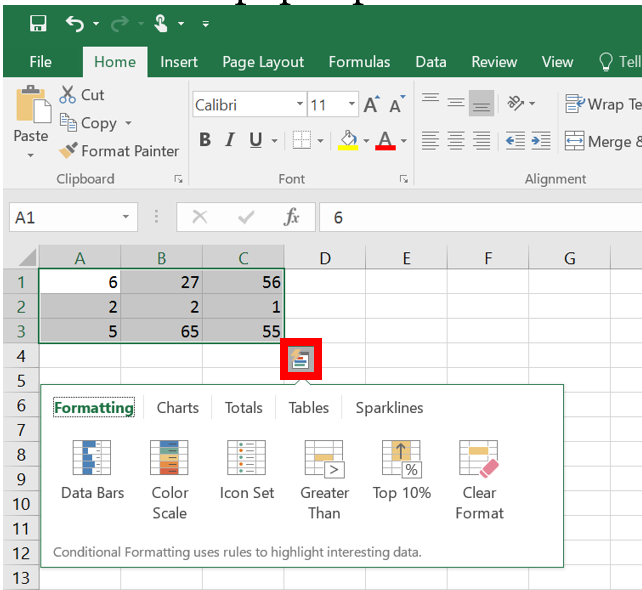
1. With your data selected, open the Quick Analysis tool by pressing Ctrl + "Q."


2. Select the tab you would like to use (sparklines, formatting, tables, etc.) and hover over the options to see a preview. Note that these methods will be different depending on the nature of the data you've selected.


3. Click on your choice to create a visualization in a new worksheet.
Rate this Article:
Keywords:
