
Recommended Charts Feature in Excel
Excel offers many tools and charts for you to organize your data The Recommended Charts feature will help you choose which chart works best.
Below is a step-by-step instruction on how to use it:
Below is a step-by-step instruction on how to use it:
1. First, select or highlight the data you'd like to organize.
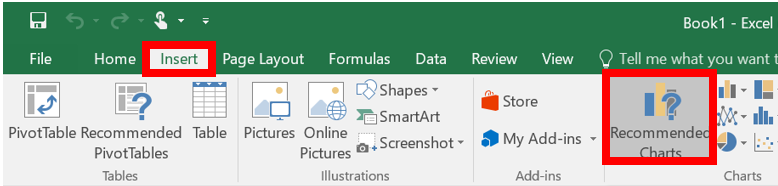
2. In the "Insert" tab on the ribbon, select "Reccomended Charts."
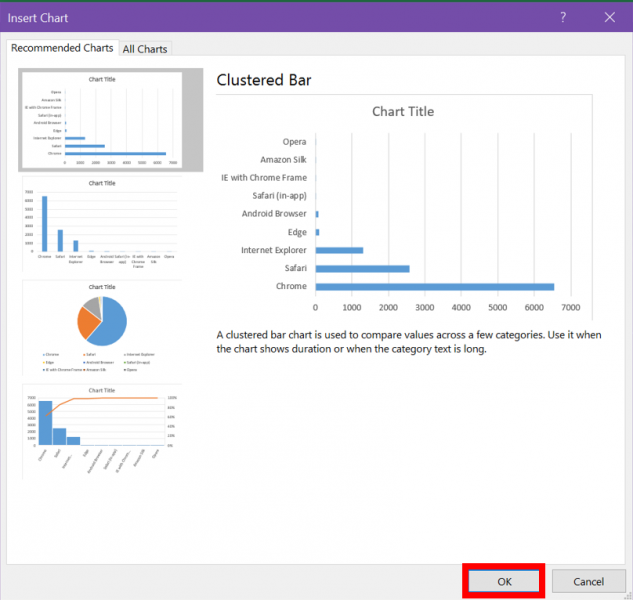
3. In the "Reccomended Charts" tab of the "Insert Chart" menu, look through the chart previews and select the chart you prefer. Click "OK."
4. Your chart will open in Excel.
4. Your chart will open in Excel.
Rate this Article:
Keywords: