
Creating a Timeline in Excel
Excel offers many tools and charts, timelines being one class of these. There are multiple layouts for timelines in Excel, and this article shows you how to create them. Though this tutorial uses Excel 2016, the steps are identical in 2013.
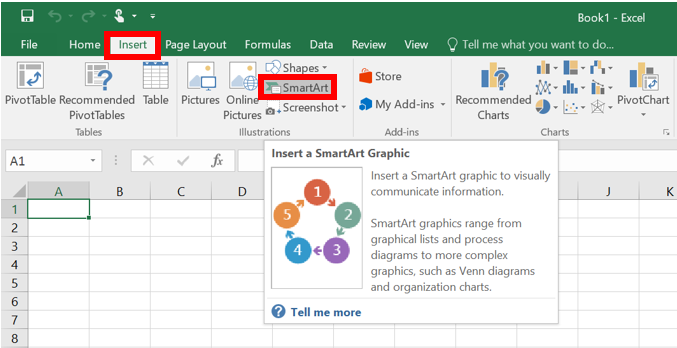
- In the "Insert" tab on the ribbon, select "Smart Art" from the "Illustrations" section.
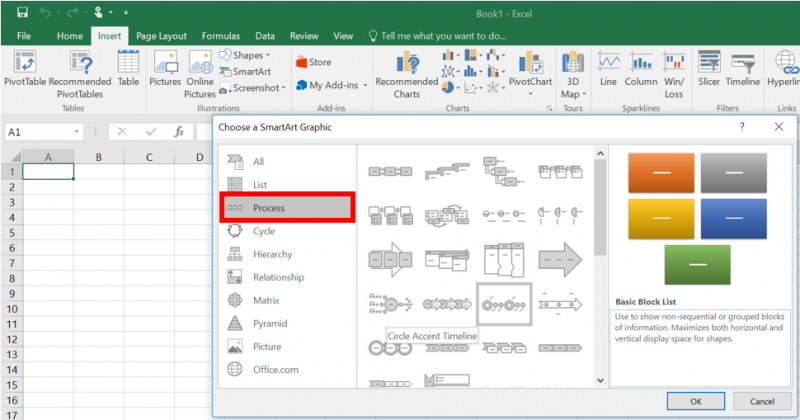
- In the left pane of the new window, select the "Process" option, then double-click one of the timeline options, or select an option and select "OK."
- Your timeline will appear on the spreadsheet.
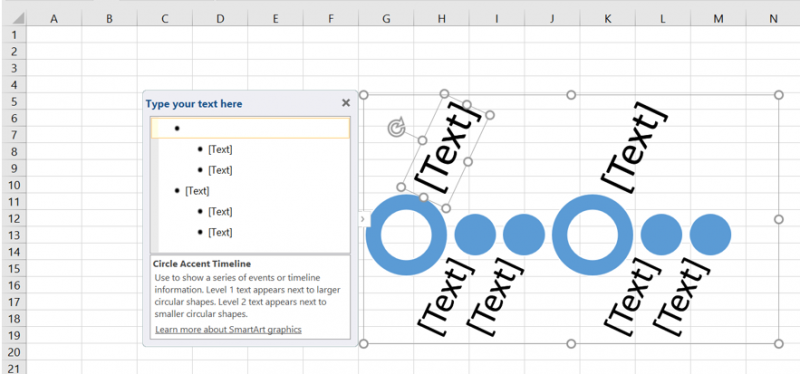
- To enter text, click on a heading in the "Type your text here" box and type over it.
- When you press enter, you will start a new line/section of the timeline. Pressing tab will enter a description of the current section.
- You can also click on [Text] in the timeline and type your text, or copy and paste text in this area.
- Note: if the text pane is not visible, you can click the small arrow to the left of the chart to expand or collapse it.
- To enter text, click on a heading in the "Type your text here" box and type over it.
Rate this Article:
Keywords: